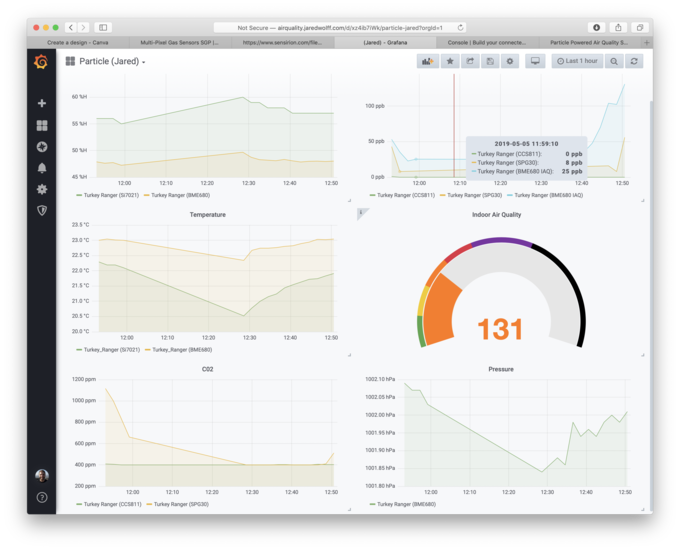
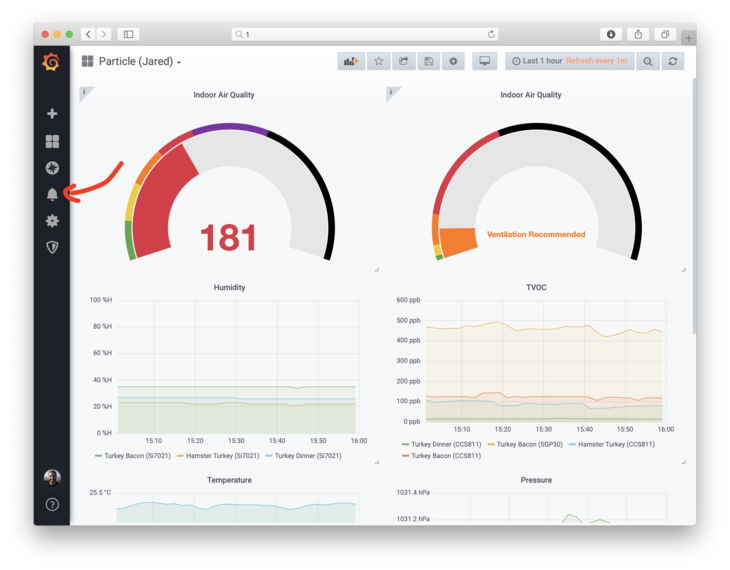
In this post, I’m going to show you how to get started with Grafana and InfluxDB running in a docker container on Digital Ocean. That way you can get on demand pretty graphs like these:
The cost?
$5 a month
Let’s get to it.
Setting up Digital Ocean and InfluxDB
-
Login to Digital Ocean. If you don’t have Digital Ocean and would like to support this blog click here to create an account.
-
Go to
Account Settings->Securityand make sure you have an SSH key setup.
-
Create a new droplet use their docker image
-
Make sure you select the $5 a month plan. For simple installs, this is more than enough!
-
SSH in once you’re done:
ssh root@<yourserverip> -
Set up InfluxDB
docker run --rm -e INFLUXDB_HTTP_AUTH_ENABLED=true -e INFLUXDB_DB=particle -e INFLUXDB_ADMIN_ENABLED=true -e INFLUXDB_ADMIN_USER=admin -e INFLUXDB_USER=grafana -v influxdb:/var/lib/influxdb influxdb /init-influxdb.shWatch the output of this command. It will generate passwords for both your
adminandgrafanauser. Save these in a safe place!Note: you should be specifically looking for lines that look like this:
INFLUXDB_USER_PASSWORD:LYLAysrR_YG1s6oEDJTzLntpVZijyM8p
[httpd] 127.0.0.1 - admin [22/Aug/2019:01:41:53 +0000] "GET /ping HTTP/1.1" 204 0 "-" "InfluxDBShell/1.7.7" 0498fb71-c47e-11e9-8005-0242ac110002 69
ts=2019-08-22T01:41:53.358064Z lvl=info msg="Executing query" log_id=0HPkdL90000 service=query query="CREATE USER grafana WITH PASSWORD [REDACTED]"
and
Unable to find image 'influxdb:latest' locally
latest: Pulling from library/influxdb
9cc2ad81d40d: Pull complete
e6cb98e32a52: Pull complete
ae1b8d879bad: Pull complete
04e291e7182c: Pull complete
8a1d428a64d3: Pull complete
46b36f496f9c: Pull complete
4fd89c5201ab: Pull complete
b0f09a31bec5: Pull complete
Digest: sha256:cfaedba9f2029b8e031c1ebaba1f7b258cba854d3b2cacab75e9e616102c97bb
Status: Downloaded newer image for influxdb:latest
INFLUXDB_ADMIN_PASSWORD:sTqjtckmyEFJQeOX7Vv97fshCBM1ow_W
Specifically, keep your eyes peeled for
INFLUXDB_USER_PASSWORDandINFLUXDB_ADMIN_PASSWORD. -
Start influx
docker run -d -p 8086:8086 \ -v influxdb:/var/lib/influxdb \ -e INFLUXDB_HTTP_AUTH_ENABLED=true \ influxdb -
Add firewall rule
ufw allow 8086This allows the outside world to get to your InfluxDB instance.

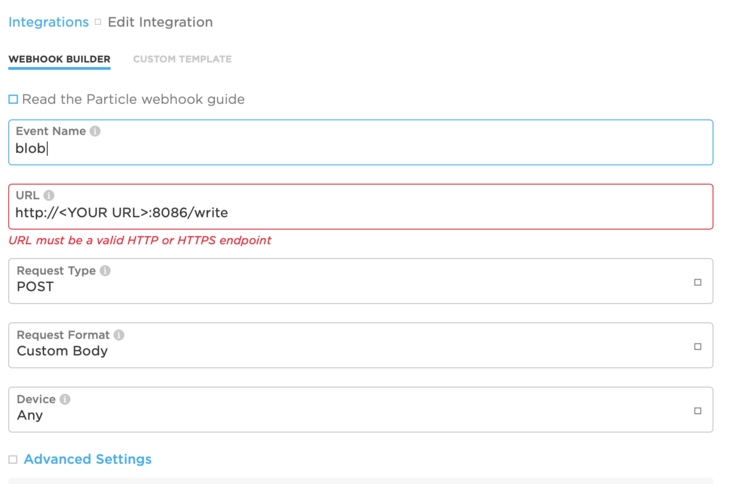
Set up Particle Integration / Webhook
Setup your URL to match the external URL of your InfluxDB instance. It should look something like this:
http://<your url>:8086/write
For the request type use POST.
Example equivalent call:
curl -i -XPOST 'http://<DOCKER IP HERE>:8086/write?db=particle' --data-binary 'temperature,id=<ID HERE> value=22.1'
The version of this to put in the custom request would be:
temperature,id={{{PARTICLE_DEVICE_ID}}} value={{{temperature}}}
Note: make sure you click the copy button above. Any whitespace may cause errors.

Note: see under QUERY PARAMETERS that db is pointing to particle. This should point to whatever you set INFLUXDB_DB to in step 6
Second Note: make sure that the username and password is the one you set up on step 6 as well. In this example the username is grafana
Here’s a more complex version. Click the Copy button to copy it to your clipboard.
temperature,id={{{PARTICLE_DEVICE_ID}}} value={{{temperature}}}
humidity,id={{{PARTICLE_DEVICE_ID}}} value={{{humidity}}}
{{#tvoc}}tvoc,id={{{PARTICLE_DEVICE_ID}}} value={{{tvoc}}}{{/tvoc}}
{{#c02}}c02,id={{{PARTICLE_DEVICE_ID}}} value={{{c02}}}{{/c02}}
{{#pm25}}pm25,id={{{PARTICLE_DEVICE_ID}}} value={{{pm25}}}{{/pm25}}
{{#pm10}}pm10,id={{{PARTICLE_DEVICE_ID}}} value={{{pm10}}}{{/pm10}}
{{#sgp30_tvoc}}sgp30_tvoc,id={{{PARTICLE_DEVICE_ID}}} value={{{sgp30_tvoc}}}{{/sgp30_tvoc}}
{{#sgp30_c02}}sgp30_c02,id={{{PARTICLE_DEVICE_ID}}} value={{{sgp30_c02}}}{{/sgp30_c02}}
{{#bme680_pres}}bme680_pres,id={{{PARTICLE_DEVICE_ID}}} value={{{bme680_pres}}}{{/bme680_pres}}
{{#bme680_iaq}}bme680_iaq,id={{{PARTICLE_DEVICE_ID}}} value={{{bme680_iaq}}}{{/bme680_iaq}}
{{#bme680_temp_calc}}bme680_temp_calc,id={{{PARTICLE_DEVICE_ID}}} value={{{bme680_temp_calc}}}{{/bme680_temp_calc}}
{{#bme680_hum_calc}}bme680_hum_calc,id={{{PARTICLE_DEVICE_ID}}} value={{{bme680_hum_calc}}}{{/bme680_hum_calc}}
For conditional data you can wrap the whole line in the variable that may or may not be there:
{{#bme680_pres}}<insert stuff related to bme680_pres>{{/bme680_pres}}
-
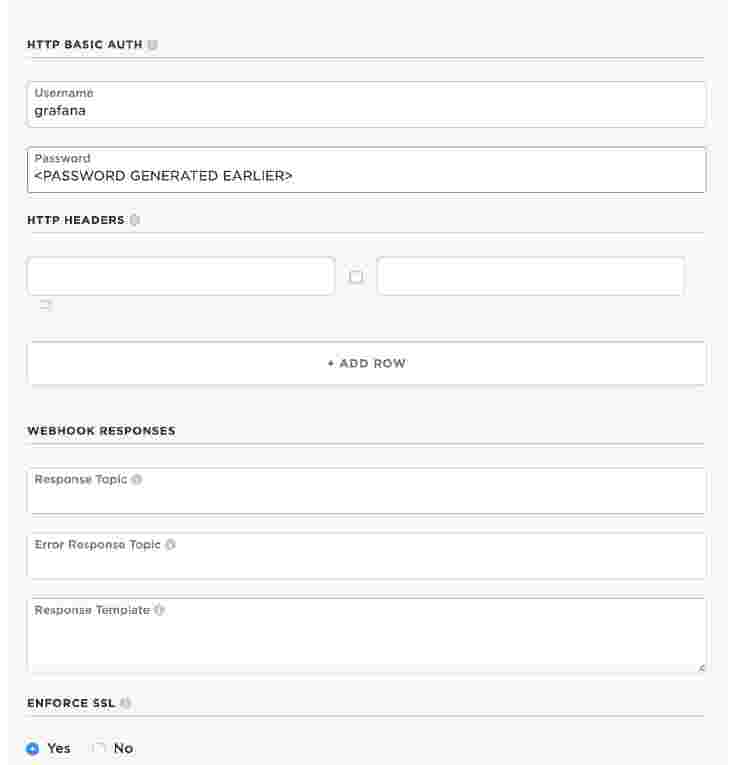
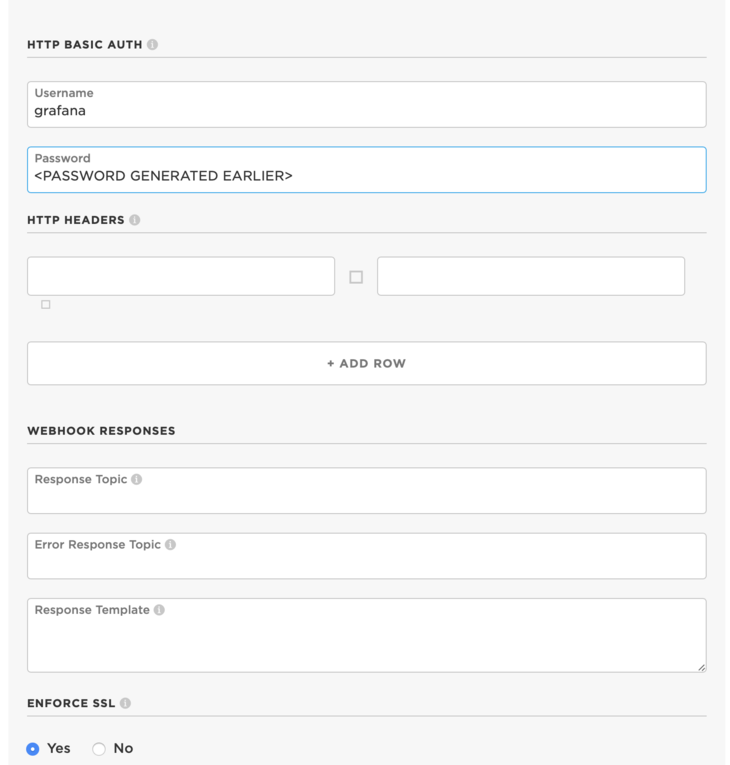
Add your HTTP auth credentials
Under HTTP BASIC AUTH insert the credentials that were added earlier
Note if you use the Test button in your Webhook integration it will likely return an error. If you look closely you’ll see the data is invalid:
HTTP/1.1 400 Bad Request
Content-Length: 140
Content-Type: application/json
Date: Thu, 19 Sep 2019 17:32:19 GMT
Request-Id: 6e3308de-db03-11e9-ad36-0242c0a85006
X-Influxdb-Build: OSS
X-Influxdb-Error: unable to parse 'temperature,id=api value=': missing field value unable to parse 'humidity,id=api value=': missing field value
X-Influxdb-Version: 1.7.6
X-Request-Id: 6e3308de-db03-11e9-ad36-0242c0a85006

{"error":"unable to parse 'temperature,id=api value=': missing field value\nunable to parse 'humidity,id=api value=': missing field value"}
Notice the error at the end? It’s missing an entry for
value. The best way is to check if it’s working is by running your intergration with real data. You can go into your integration and check for errors here:
Setting Up Your Grafana
-
Next! Install Grafana with persistent storage
# create a persistent volume for your data in /var/lib/grafana (database and plugins) docker volume create grafana-storage # start grafana docker run \ -d \ -p 3000:3000 \ --name=grafana \ -v grafana-storage:/var/lib/grafana \ grafana/grafana -
Add firewall rule for graphana
ufw allow 3000 -
Login. This should be your Digital Ocean Droplet ip + :3000 appended. Example:
123.456.789.101:3000(Default username and password is admin and admin) -
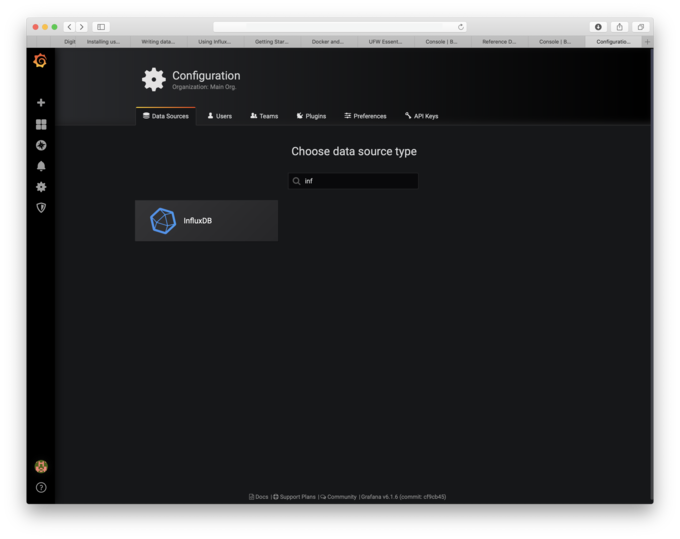
Connect Grafana to Influx (should be one of the first options on a fresh Grafana install)
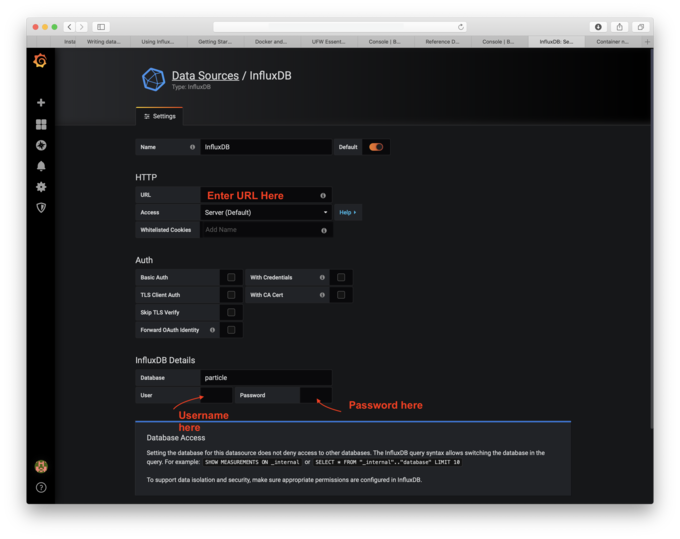
Note under user, you’ll have to put the username
grafanaand the generated password from step 6. Also the name of the database has been set asparticlein the same step. -
Test your connection by clicking
Save & TestIt should come back quickly saying whether or not a connection has been successful. -
Start up your device, if not already, and get it publishing to your InfluxDB database.
(Need data? This project should get you some!)
-
Create graphs!
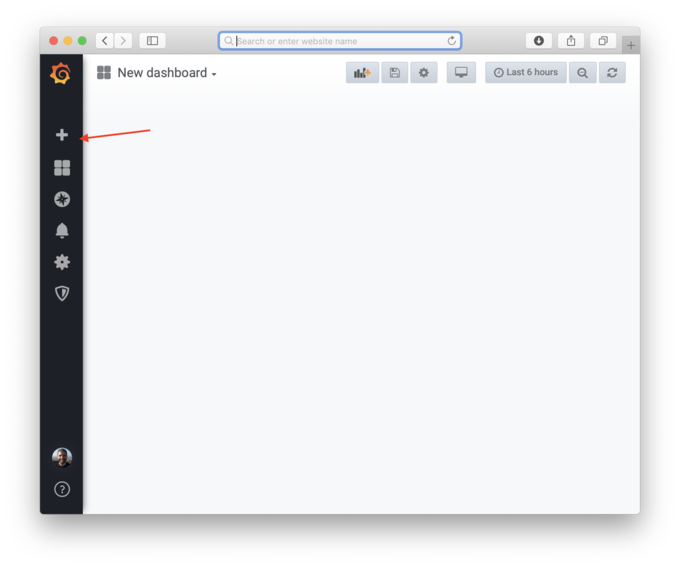
Finally, the reason why you came to this page: pretty graphs
Click the + icon on the left and create a new dashboard
-
Select
Add Query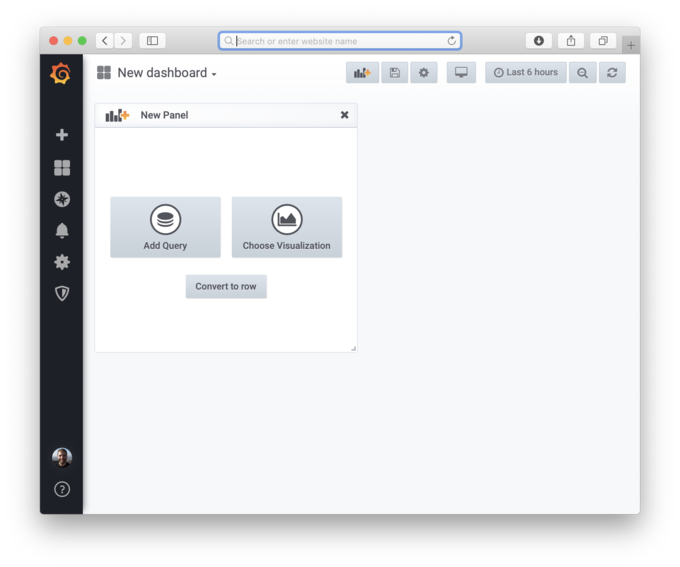
-
Go down and click
select measurementIf your device has been publishing to your database, you should see some options for values.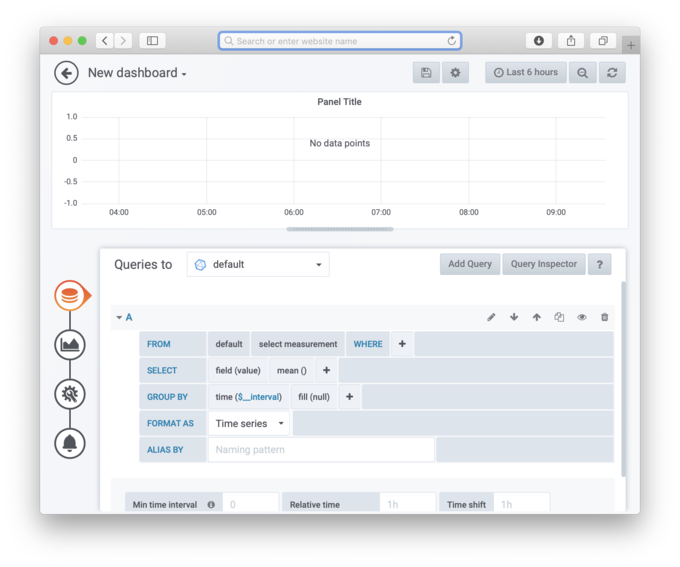
-
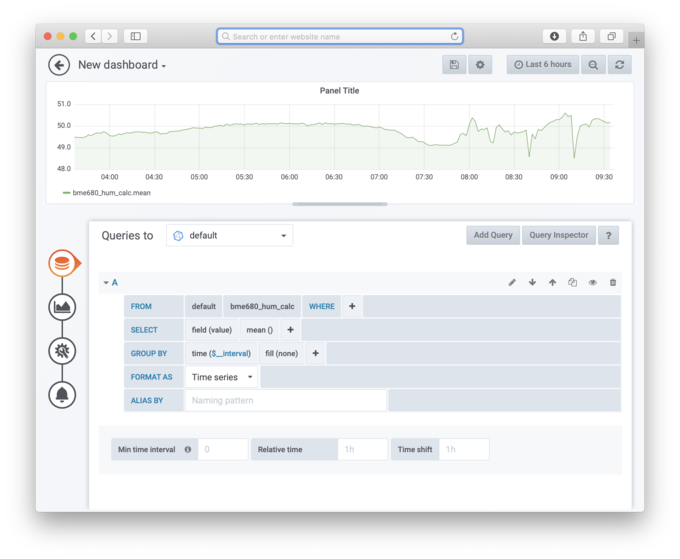
Under
fill(null)change that tofill(none). That should give you a nice line between datapoints. -
You should see the graph appear!
-
Click the back arrow button and then click the save button.
-
You now created a simple graph on the data directly from your device! I recommend you play around with the Grafana interface. It’s fairly intuitive and takes only a few short minutes to get used to!


Added Fun: HTTPS/SSL
Update I’ve since ditched the Let’s Encrypt helper image for Traefik. It’s one image and it’s fairly easy to setup. Here’s an example Docker Compose file that I use:
For Traefik itself.
version: '3'

services:
  reverse-proxy:
    container_name: traefik
    image: traefik
    command: --docker
    restart: always
    ports:
      - 80:80
      - 443:443
    networks:
      - webproxy
    volumes:
      - /var/run/docker.sock:/var/run/docker.sock
      - ./data/traefik/traefik.toml:/traefik.toml
      - ./data/traefik/acme.json:/acme.json
    labels:
      - "traefik.enable=false"

networks:
  webproxy:
    external: true
with the appropriate .toml file:
debug = false

logLevel = "ERROR"
defaultEntryPoints = ["https","http"]

[entryPoints]
  [entryPoints.http]
  address = ":80"
    [entryPoints.http.redirect]
    entryPoint = "https"
  [entryPoints.https]
  address = ":443"
  [entryPoints.https.tls]

[retry]

[docker]
endpoint = "unix:///var/run/docker.sock"
domain = "<your root domain>"
watch = true
exposedByDefault = false

[acme]
email = "<your email>"
storage = "acme.json"
entryPoint = "https"
onHostRule = true
[acme.httpChallenge]
entryPoint = "http"
For Grafana
version: '3'

services:
  grafana:
    image: grafana/grafana
    container_name: grafana
    environment:
      GF_SMTP_ENABLED: "true"
      GF_SMTP_HOST: ${SMTP_HOST}
      GF_SMTP_USER: ${SMTP_USERNAME}
      GF_SMTP_PASSWORD: ${SMTP_PASSWORD}
      GF_SMTP_FROM_ADDRESS: ${SMTP_FROM_ADDRESS}
      VIRTUAL_HOST: ${GRAFANA_URL}
      VIRTUAL_PORT: 3000
      LETSENCRYPT_HOST: ${GRAFANA_URL}
      LETSENCRYPT_EMAIL: ${EMAIL}
    restart: always
    volumes:
      - grafana-storage:/var/lib/grafana
    networks:
      - webproxy
    labels:
      - "traefik.backend=grafana"
      - "traefik.docker.network=webproxy"
      - "traefik.frontend.rule=Host:{GRAFANA_URL}"
      - "traefik.enable=true"
      - "traefik.port=3000"

networks:
  webproxy:
    external: true

volumes:
  grafana-storage:
    external: true
For InfluxDB
version: '3'

services:
  influxdb:
    image: influxdb
    container_name: influxdb
    environment:
      VIRTUAL_HOST: ${INFLUXDB_URL}
      VIRTUAL_PORT: 8086
      LETSENCRYPT_HOST: ${INFLUXDB_URL}
      LETSENCRYPT_EMAIL: ${EMAIL}
      INFLUXDB_HTTP_AUTH_ENABLED: "true"
    restart: always
    volumes:
      - influxdb:/var/lib/influxdb
    networks:
      - webproxy
    labels:
      - "traefik.backend=influxdb"
      - "traefik.docker.network=webproxy"
      - "traefik.frontend.rule=Host:${INFLUXDB_URL}"
      - "traefik.enable=true"
      - "traefik.port=8086"

networks:
  webproxy:
    external: true

volumes:
  influxdb:
    external: true
All environment variables should be set or included in a .env file. The .env file must be kept in the same directory as the Docker Compose .yml
To run, use this command:
docker-compose -f <docker compose>.yml up -d
You may need to create the external network and volumes if they haven’t been already. This uses docker network create and docker volume create respectively.
Setting Up Your First Alert
One of the coolest benefits of using Grafana is that it comes with built in notifications. Not only that but it can use almost any service you can think of to generate those notifications.
First let’s click on the bell icon in the left column:
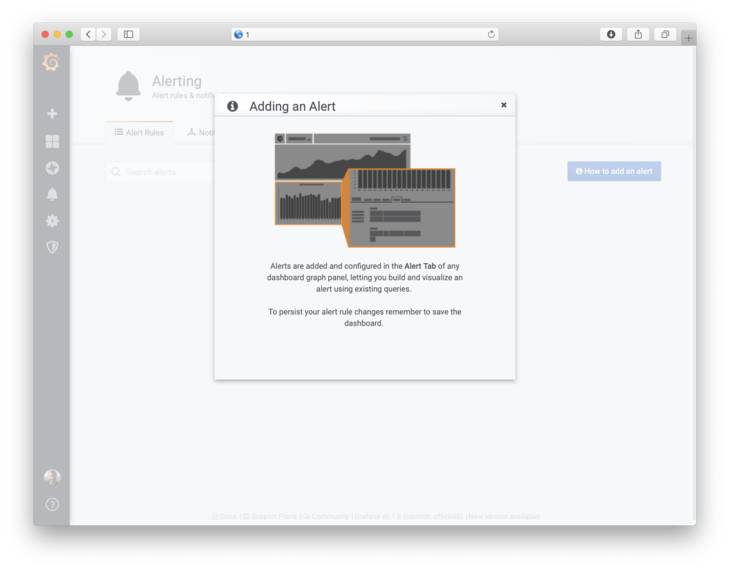
In the next window you’ll notice an Alert Rules tab and Notification Channels If you try to create a new rule here, it will educate you where you need to go.
Before we do, let’s configure a Notification Channel. As mentioned before they have everything under the sun including:
- Pushover (my current favorite)
- Discord
- Telegram
- Line
- Hipchat
- Slack
- And more!
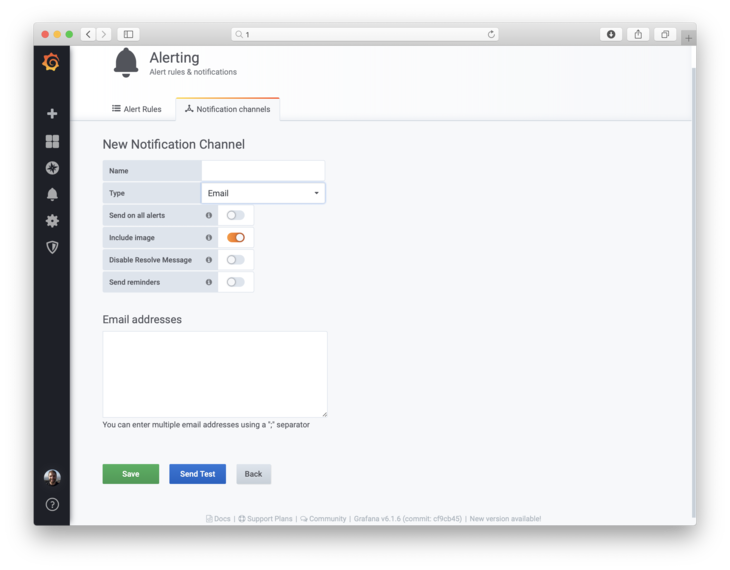
If your service is not here you can configure the webhook option. You’ll need a URL, HTTP method and any authentication settings. If your service requires more (like API keys, etc), you may have to get creative on connecting through a separate service.
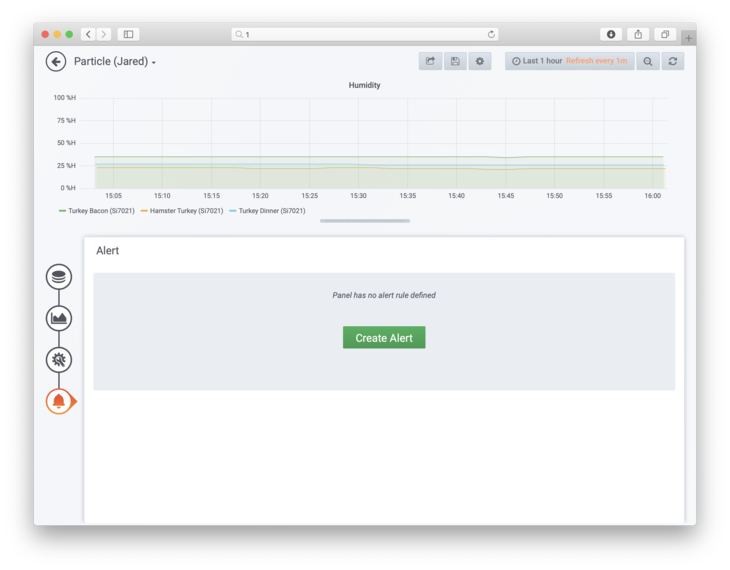
In order to add a rule to trigger a notification, go to one of your Panels. Then click on the bell icon in the bottom left hand corner. Then, click the Create Alert button.
The next step will then ask you to enter the parameters that will trigger the alert. Tweak until you’re happy with them!
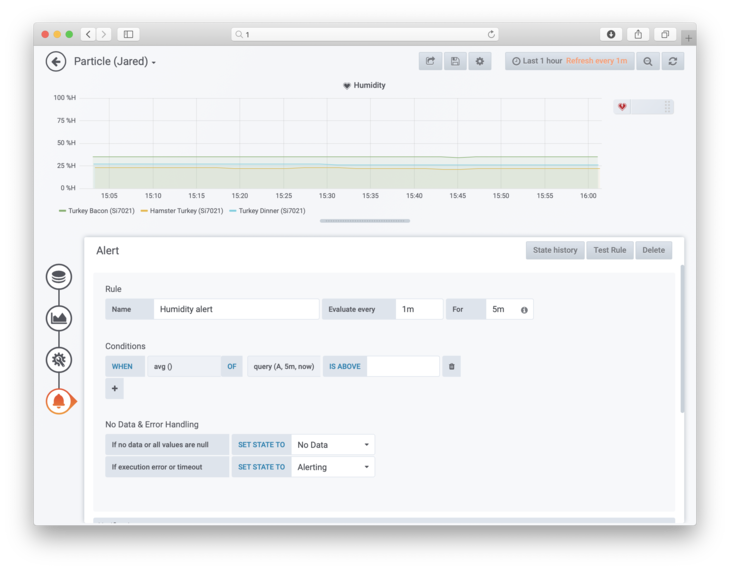
Then select where to send the notification and a message if necessary. Finally
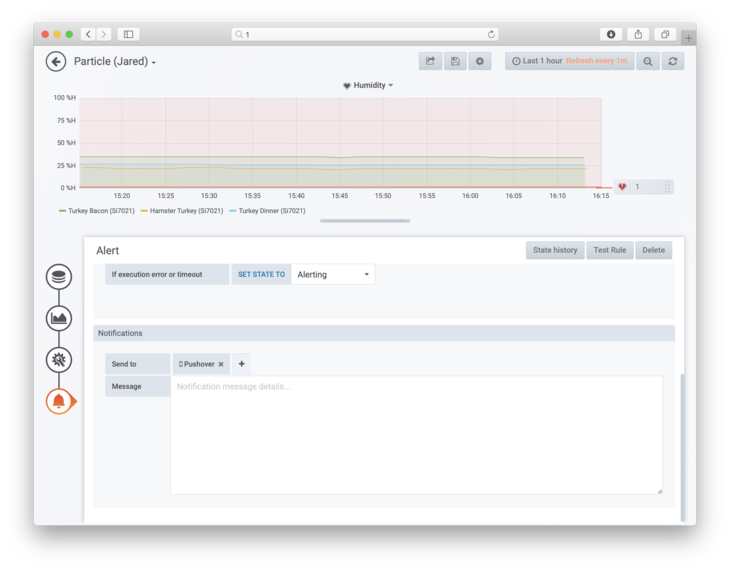 ;
;
Make sure you Save your settings once you’re done. You can also click on Test Rule. This will show the output of what would go to your notification service.
Congrats! You’ve set up your first notification. Now you can do the same for all your other panels/data points.
OLD INSTRUCTIONS – Installing HTTPS/SSL is fairly straight forward. Follow the steps below:
-
Stop the Grafana instance if you haven’t already
-
Start a new container with
nginx-proxydocker run --detach \ --name nginx-proxy \ --publish 80:80 \ --publish 443:443 \ --volume /etc/nginx/certs \ --volume /etc/nginx/vhost.d \ —volume /usr/share/nginx/html \ —volume /var/run/docker.sock:/tmp/docker.sock:ro \ jwilder/nginx-proxy -
Run the
letsencrypt-nginx-proxy-companiondocker run —detach \ —name nginx-proxy-letsencrypt \ —volumes-from nginx-proxy \ —volume /var/run/docker.sock:/var/run/docker.sock:ro \ jrcs/letsencrypt-nginx-proxy-companion -
Restart the Grafana container
docker run \
  -d \
	--env "VIRTUAL_HOST=<YOUR SUBDOMAIN ADDRESS>" \
  --env "VIRTUAL_PORT=3000" \
  --env "LETSENCRYPT_HOST=<YOUR SUBDOMAIN ADDRESS>" \
  --env "LETSENCRYPT_EMAIL=<YOUR EMAIL ADDRESS>" \
  --name=grafana \
  -v grafana-storage:/var/lib/grafana \
  grafana/grafana
Note: make sure you replace
<YOUR SUBDOMAIN ADDRESS>and<YOUR EMAIL ADDRESS>above with your own info.
The proxy companion will generate an SSL certificate for the virtual host that you provided to the Grafana container. The proxy is used to forward all HTTP/HTTPS traffic to your Grafana container. It’s clean, it’s simple and it’s secure!
Note InfluxDB is a bit more difficult. You either need to make a separate subdomain or configure HTTPS to share the certs between Grafana and Influx. This Docker Compose script does it all if you haven’t already installed everything. You can follow the same steps above if you want to run it on a separate sub-domain.
Handy Links
Here are some handy links that I found useful getting started with Grafana + InfluxDB
- Traefik on Github
- influxdb | Docker Documentation
- Getting Started | Grafana Documentation
- Installing using Docker | Grafana Documentation
- Let’s Encrypt Nginx Proxy Companion
- Very Handy about Setting up HTTPS for both Grafana and Influx
Conclusion
You made it. Enjoy your new Grafana + InfluxDB install!
Looking for more?
Here’s the video overview of Grafana:
If you liked this tutorial, please share with your friends and your enemies. Also if you’re craving more, check out how to build your own air quality sensor using only a few parts.
Last Modified: 2020.9.26