After frustratingly watching my money not do much for itself over the past couple years ago, I decided to look into the different ways I could invest and learn.
I had heard about forex from different sources but I decided to give it a whirl and not loose too much money in the process. As part of the process, I noticed that some of the indicators didn’t quite do what I wanted or I would get inspired by an indicator offered for sale and see if I could roll in those features for my own use. At first, I searched the web for said functionality but unfortunately some of these things are one of a kind.
So, like any good computer engineer would do, I dove into the programming aspect of things. In this post I want to highlight the skeleton of an indicator and the functionality of certain methods. The idea here is to give aspiring MQL4 programmers with a basis to continue their journey.
Note: I am, by far, not an expert at programming for MetaTrader4 but I have successfully created, and modified, a few indicators that I use now.
Indicator location
I’m currently using the FXCM version of MetaTrader. The location for all indicators is here:
C:\Program Files\FXCM MetaTrader 4\MQL4\Indicators\
Note: My path is slightly different as i’m using PlayOnMac to run MetaTrader4 and MetaEditor. Also note: you can use any editor you’d like as the syntax is very close to C/C++. You will need to use MetaEditor to “compile” your indicator before use. More on that in a bit.
The .mq4 file
This is the file that houses all your source code. Think of it as your .c or .cpp or .rb file. Important! You can track any of your changes using a standard Git repository if your anal like me. That way if you implement a change and things don’t work out you can regress back to a working state without pulling out your hair.
The header
These are straight forward global variables/properties. Change them as you see fit.
#property copyright "Jared Wolff"
#property link      "www.jaredwolff.com"
#property version   "1.00"

#property description "Sends alerts on volumes that are past a certain theshold. Marks the chart when a threshold event occurs."
#property description "Tweakable values include how many bars of action to go back to obtain average, and then the multiplier factor to enable notifications."
#property description "Can be used with SMTP alerts and PUSH notifications."
Important properties
More important than the above, the below should always be included in your file:
#property indicator_chart_window
#property indicator_buffers 4
indicator_chart_window indicates whether or not the indicator operates in its own screen or on the chart screen. Depending on what you’re trying to do will dictate what you choose. The other choice is indicator_separate_window.
indicator_buffers specifies how many different display buffers will be necessary for this plugin. More on this in a bit but this is important to get right. For instance if you have 3 separate lines (think 3 different moving averages) and 1 histogram then you need at least 4 indicator buffers.
Modifiable Variables
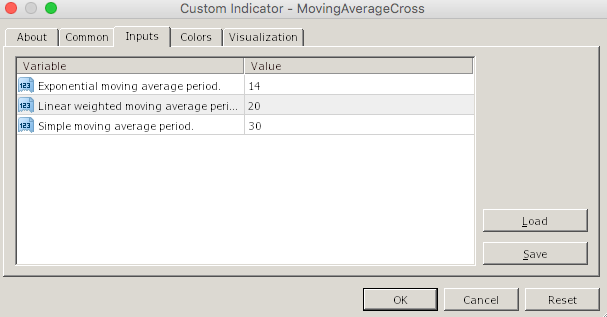
Here are some examples of variables that show up in the Custom Indicator “Inputs” screen. (see below)
extern int EMAPeriod = 14; // Exponential moving average period.
extern int LWMAPeriod = 20; // Linear weighted moving average period.
extern int SMAPeriod = 40; // Simple moving average period.
Indicator properties
Each indicator buffer has properties associated with it. These properties are appended with a number (where the index starts with 1 rather than 0). These properties manage how a buffer of data will be displayed.
#property indicator_label1  "Line"
#property indicator_type1   DRAW_LINE
#property indicator_color1  clrWhite
#property indicator_style1  STYLE_DOT
#property indicator_width1  1
indicator_type1 displays characteristically different information. The choices (from the MQL4 website) are:
| Constant | Value | Description |
|---|---|---|
| DRAW_LINE | 0 | Simple line |
| DRAW_SECTION | 1 | Sections between nonempty line values |
| DRAW_HISTOGRAM | 2 | Histogram |
| DRAW_ARROW | 3 | Arrows (symbols) |
| DRAW_ZIGZAG | 4 | Drawing sections between even and odd indicator buffers |
| DRAW_NONE | 12 | No drawing |
Referenced from this page. For DRAW_ARROW you will need to specify an “arrow type” more on that in a bit.
indicator_color1 is the most important property here. Your list of choices can be found here.
indicator_style1 indicates whether your want dotted or solid lines, etc. The options you have are the following:
| Constant | Value | Description |
|---|---|---|
| STYLE_SOLID | 0 | Solid line |
| STYLE_DASH | 1 | Dashed line |
| STYLE_DOT | 2 | Dotted line |
| STYLE_DASHDOT | 3 | Dash-and-dot line |
| STYLE_DASHDOTDOT | 4 | Double dotted dash-and-dot line |
indicator_width1 is an all around useful property which determines the thickness of a line, or how large an arrow is, etc. The values go from 1 to 5.
Remember: the indicator_label1 or indicator_type1 should change to correspond with the index of the buffer. So if the index is set to 4 then the numbers proceeding the property names should be 5. (ex. indicator_type5) More on this below.
Indicator buffers
The indicator buffers are the heart of your indicator. These are the buffers that get the data translated from the calculations being done in your code to the screen in MT4. For everything you want to display you will need at least one buffer. If you want multi-color items (think multi-color line or histograms) you will need a buffer for each color. There may be a better way of going about that issue but this is the best solution i’ve found thus far!
//--- indicator buffers
double         LineBuffer[];
Registering the buffer
Much like an Arduino sketch, MQL4 has an init() function and then a main() function that gets called every time a new tick has been received. OnInit, as a reminder, is only run once. Check out an example below
int OnInit()
{
 //Sets the style
 SetIndexStyle(0,DRAW_LINE);

 // indicator buffers mapping
 SetIndexBuffer(0,LineBuffer);

 //Label!
 SetIndexLabel(0, "Above Average");

 //Set the starting point of drawing the line
 SetIndexDrawBegin(0,MovingAveragePeriod);

 return(INIT_SUCCEEDED);
}
SetIndexStyle again sets the style of the line or item you’re trying to display. Same as indicator_type1 above. The first argument is the index that will be tied to the buffer. For every setting regarding that buffer you need to ensure you’re using the same index number. If you have multiple elements (lines, histograms, etc) this number must be incremented! In my example above, I only have one line. If you have multiple you would need to copy every line, edit the index to 1, and update the SetIndexBuffer method.
SetIndexBuffer attaches a buffer to an index. This is important otherwise the data you put in the buffer will not be displayed correctly or at all!
SetIndexLabel is straight forward. Label it what you will!
SetIndexDrawBegin starts the display cursor where data will be showing up. In my case, because I was using a moving average, data isn’t available until you reach the first full period of data. Typical is 14 but can be more or less.
OnCalculate
The arguments to the OnCalculate function give you everything you need to manipulate the data on the chart in front of you. Everything is placed into arrays and each array index represents one bar in the chart.
int OnCalculate(const int rates_total,
                const int prev_calculated,
                const datetime &time[],
                const double &open[],
                const double &high[],
                const double &low[],
                const double &close[],
                const long &tick_volume[],
                const long &volume[],
                const int &spread[])
  {

   //--- return value of prev_calculated for next call
   return(rates_total);
  }
Some important things to remember here:
-
tick_volumeis saved as a long datatype for what ever reason. If you need to do any math with it you will have to copy the array and cast it to a double. Becausetick_volumeis usually a whole number (when would it not?) there shouldn’t be much lost in translation. (long to double we lose precision in the decimal areas and the max allowed integer size – not a worry here) -
timeis handy especially when debugging. Things start to get confusing when one data array is backwards and another one being used is reverse. More on that below. -
rates_totalare the maximum amount of bars available to the indicator. This number typically does not change on the same time scale but does change when you change the time scale. (Thing M30 to H1 or H4) -
prev_calculatedis the value returned at the end ofOnCalculate
All the other entries are self explanatory.
Data order?!
The biggest thing that has tripped me up has been the order of data. In some cases the arrays can be indexed to where index 0 is the most recent bar from the chart but in some cases index 0 can also indicate the oldest bar.
   bool as_series_time=ArrayGetAsSeries(time);
   bool as_series_close=ArrayGetAsSeries(close);

   if( as_series_time ) {
     // Print("Time as series.");
     ArraySetAsSeries(time,false);
   }

   if( as_series_close ) {
     // Print("Time as series.");
     ArraySetAsSeries(close,false);
   }
ArrayGetAsSeries returns what type of indexing scheme the array is currently using. In this case, it’s checking whether or not the index 0 is the oldest bar. When ArraySetAsSeries is invoked, false will keep the index 0 at the oldest bar but changing it to true will flip the array where index 0 is the latest bar.
Processing the data
In my example, I was running a moving average on the closing prices of each bar. In order to run the MA function, I needed to make a copy of the close array. (I think this stems to the fact that the close array is static and immutable.) ArrayCopy does the job nicely here. You also have the option of reversing the array if you’d like. More info on this command is here.
   ArrayCopy(close_copied,close,0,0,WHOLE_ARRAY);

   int limit=rates_total-prev_calculated;

   if (limit == 0) {
     limit = 1;
   }

   //--- main loop
   for(int i=0; i<limit; i++) {
       //--- ma_shift set to 0 because SetIndexShift called abowe
       LineBuffer[i] = iMAOnArray(close_copied, 0, LWMAPeriod, 0, MODE_LWMA, i);
In order to avoid recalculating the whole buffer I made a quick modification that only updates the latest data after the first go around.
The iMAOnArray function is the bread and butter of what’s going on here.
- Its first argument is the buffer that the data is in.
- The next argument is how much of the array should be processed. 0 indicates that the whole array should be processed.
- The next value is the period (or the amount of historical data points that are processed in the moving average calculation).
- The next is a shift to the moving average. Generally, left at 0.
- The next parameter is indicating what type of method is used. I have used MODE_SMA, MODE_LWMA and MODE_EMA with success.
- The last parameter indicates the index in the array you have fed it to start the calculation. This index is important otherwise you’ll be running the calculation on the same 14 numbers over and over..
Testing
Once you think all your ducks are in a row time for a quick test:
- Open your indicator in MetaEditor
- Click the compile button.
- Fix any errors
- Compile again
- Go to MetaTrader4 ‘Navigator’ screen.
- Right click and select ‘Refresh’
- Navigate to the ‘Indicators’ folder
- Drag your indicator to the chart you would like it displayed.
Your indicator should display immediately. If not go to your terminal and click the experts tab. This is where all the debug output from indicators are displayed. Sometimes it’s an index out of bound error but sometimes it’s simply a mistake in setting up your buffer correctly!
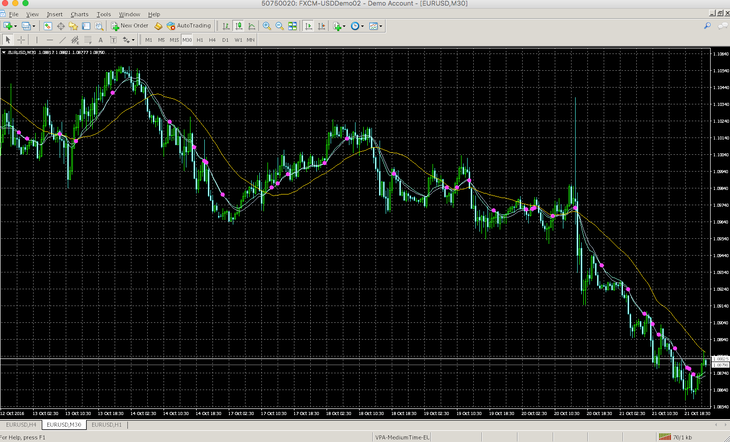
In my case, I whipped up a combo moving average indicator. It places a dot over the areas where the LWMA and the EMA intersect. Useful for folks who take value in that information!
Conclusion
That is my short and to the point into to programming for MetaTrader4. If there are things that I could have done better feel free to sound off in the comments. There are definitely different ways to get to the same solution! I hope that this has been useful for you and good luck on your trading endeavors!
Last Modified: 2020.3.7